Calculating ROI: Is Your Fraud Solution Delivering?

Fraud detection as a means to boost revenue is an important growth strategy. And ROI, or return on investment, is a crucial part of assessing the resilience of your fraud operations. The broad term “fraud management” accounts for metrics like approval rates, and chargebacks. But accurately calculating ROI goes well beyond these two numbers. False declines, brand reputation, and customer lifetime value (CLTV) must be considered to assess lost potential, and merchants also need to account for their fraud platform’s ability to recover lost revenue, and to support expansion and growth from new markets. These can be more elusive parameters to access and evaluate.
In this blog, I will break down an ROI calculation from one of our partners to demonstrate how an effective fraud strategy can directly impact your bottom line.
Risk vs. opportunity
ROI calculations require a good understanding of the story behind the numbers. If merchants approach orders as risks rather than opportunities, the result will be a defensive fraud management strategy, which will lower approval rates. High-friction verification methods are a fallback for these risk-averse merchants, but customers often choose to shop elsewhere when faced with a complicated checkout.
An operation that prioritizes higher approval rates risks getting hit with unexpected chargebacks and may become an easy target for fraud. When merchants plan to sell cross-border, the balance becomes even trickier. Unfamiliar shopping, payment and fraud patterns can trigger caution among merchants. If they respond with blacklists or strict fraud rules, they’ll end up turning away a large pool of potential international customers and will end up hurting their brand, but they may not account for these “hidden” metrics in their overall ROI calculation.
With this in mind, let’s take this online retailer as an example:
- European consumer electronics retailer
- Selling high-value electronics
- Expanding to new markets

When we reviewed this merchant’s performance, their chargeback rates were approaching 2%. That means almost 2% of their annual revenue was lost to an ineffective solution. In addition, they were declining 15% of orders. So not only were they inadvertently approving fraudulent transactions, but they were declining many good customers. The reason was quickly established: they were expanding into new markets but were apprehensive about cross-border sales. Without familiarity with local payment methods, shopping habits, shipping and fulfillment needs, fraud was difficult to discern. And the fear of letting fraudsters in dominated their fraud prevention strategy. But as this merchant found out, falsely declining customers was impacting short term revenue goals through sales, and long term revenue through customer loyalty and brand value.
Piecing together the ROI
There are four numbers to be familiar with when it comes to ROI: approval rate, approval volume, chargeback costs, and total online sales. Let’s look at our specific example:
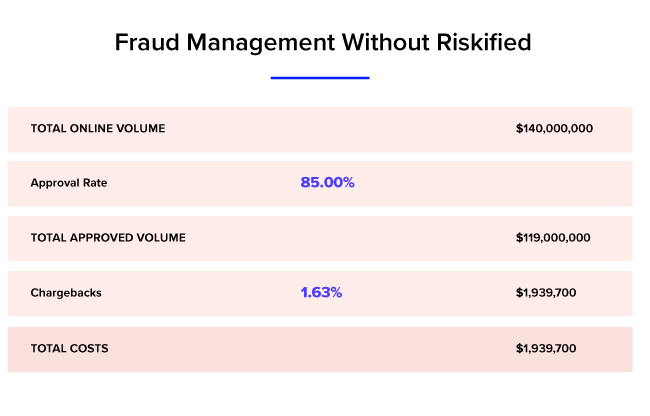
These numbers were based on their US website, which was a new and challenging segment for this retailer. Their total approved volume, $119,000,000 constituted 85% of their total online sales in this specific market. In other words, they were leaving 15%, or $21,000,000 on the table – consisting of a combination of some rightfully declined fraud, but mostly false declines. In addition, their inaccurate fraud review was showing to the sum of $1,939,700 in chargebacks.
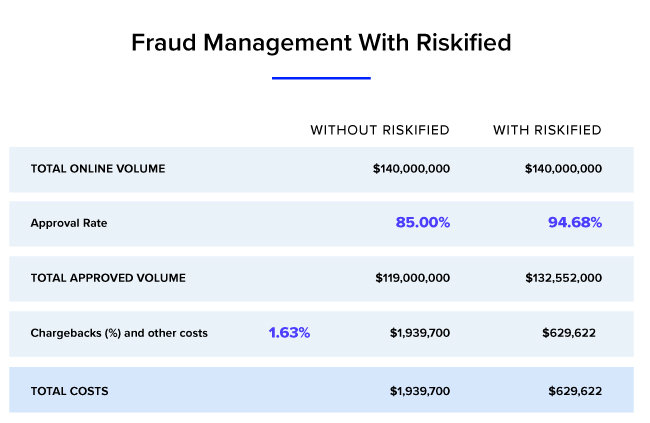
They sought to grow and scale, and decided to submit all orders to Riskified for review. For us, the more data we receive, our models are more precise and our decisions are more accurate, which means we can aim for higher approval rates. We also considered the risk level of the specific market and industry, along with historical data to target a 94.68% approval rate. So from initially turning away 15% of transactions, they would only decline 5.3%. Further, with a chargeback guarantee they would completely eliminate the cost of fraud-related chargebacks.
The result
By partnering with Riskified, revamping their approach to fraud management and updating their solution, this merchant was able to save $1,310,078 annually in operational costs. And due to a higher approval rate, they benefited from $132,552,000 in additional sales or the equivalent of a 11.38% lift.
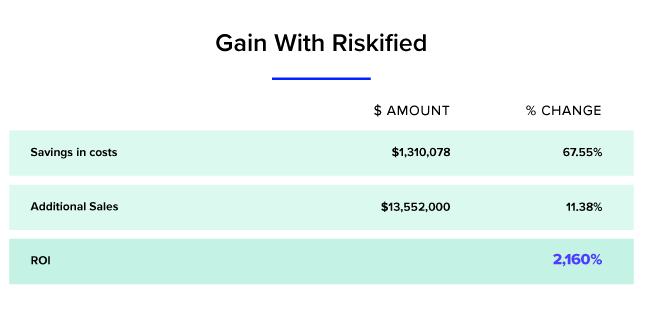
The additional sales together with the reduction in operational costs, resulted in a 2,106% return on investment. In simpler terms? The real gain comes down to accurately telling the difference between a valid shopper and a bad actor. Ultimately, this is what allows merchants to safely expand to new markets, without losing customers along the way. After ensuring the ROI, the online retailer went live with Riskified in the US market, as well as 3 additional markets within a year. Today, they are selling online in more than 20 countries, with 100% of their order volume reviewed by Riskified.
To learn more about eCommerce fraud prevention, check out our Resource Center.