Stopping Chargebacks with Data-Driven Insights

Data-based decisions help merchants protect their revenue, their customers and their brand reputation.
As any eCommerce merchant knows, chargebacks are a serious challenge to the viability of a business. Not only do they cost the refund and the value of the goods, there’s also a bank processing fee to add insult to injury. Rack up too many chargebacks and a merchant ends up at risk of being forced onto a bank’s excessive risk program, which could hike fees up even further.
Besides being costly, incurring fraud-related chargebacks means customers are being preyed upon on the platforms where they’re meant to spend, which damages customer relationships and harms brand reputation over time. In fact, almost 50% of consumers stated they wouldn’t shop at a merchant where they were victims of fraud.
All of this means stopping chargebacks should be a top priority for merchants, though it’s not always clear how to mitigate the problem. A strict fraud review regimen might lessen their number, but it might also keep out good customers who seem suspicious, driving the volume of false declines.
Ultimately, the best approach to stopping chargebacks without declining good customers is to make data-based decisions. But dealing with big data can be overwhelming, so we created a preliminary guide for how fraud trends break down across specific segments.
Fraud trends by product
For a number of reasons, different goods can be more appealing to fraudsters. Some products, such as mobile phones, are popular because they’re easy to resell on secondary markets. Others, like digital gift cards, appeal because they’re instantly fulfilled digitally — with no shipping address necessary.
Our data reveals that, in addition to phones and gift cards, sneakers, event tickets, and travel products also encounter higher rates of fraud. On the other hand, fashion and home products tend to be safer. When fraudsters do target fashion merchants, they generally go for higher-value goods. The bad news: these trends could change completely next month as new fraud tactics emerge. So the task of tracking trends through data never really ends.
Despite the shifting nature of fraud, identifying which specific products yield higher rates of chargebacks can aid a merchant in determining their risk. For example, stores that sell products of a few different big-name brands should isolate chargeback rates per product offerings. As we often find, there are some surprising differences!
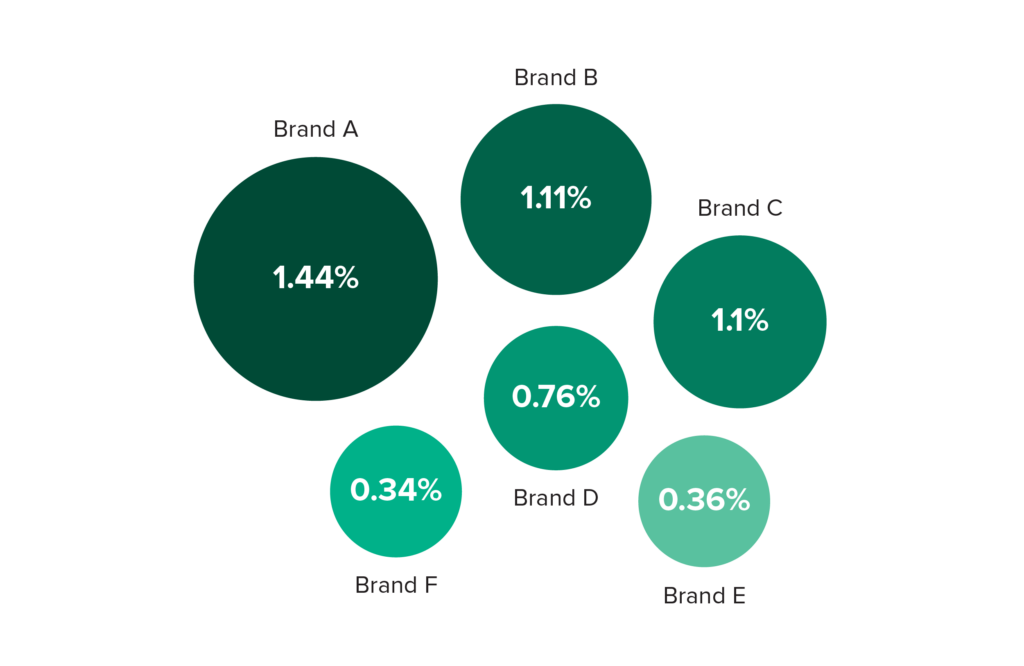
In this case, Brand A produced 4 times the number of chargebacks that Brand E did. With these insights in hand, a merchant might tighten the fraud review for Brand A products, while remaining slightly more lenient with suspicious-looking orders of Brand E products. And that’s just one angle.
Fraud trends by market
It’s only natural that certain countries are stereotyped as being “hot pockets” of fraud. However, rather than discounting entire markets, we encourage merchants to zoom in and analyze customer behavior on an individual level. Over a billion transactions, we’ve learned that many areas within high-fraud regions are actually very safe.
For example, when looking at the data across different merchants, we found that 80% of orders from Mexico could be safely approved. But by drilling down further, we saw different patterns emerge across order types. When made from within Mexico, orders using Mexican credit cards that were shipped to the United States could be safely approved 90% of the time, likely due to the large expat community. Using data to uncover this dynamic is just one method that allows us to approve more orders from Mexico, instead of turning good customers away because of an overly strict rule.
Seasonal fraud trends
Good, honest shoppers behave in different ways when they’re working or on vacation, when they’re buying for themselves or buying gifts for others. So, it’s important to understand how shoppers tend to behave during the different seasons of the year.
One prime example is the holiday shopping season. Throughout the year, most customers (around 75%) have their orders shipped to the same location as their billing address. Those that don’t may have moved houses without updating their billing address or shipped orders to their office, while others purchase gifts and have them sent directly to the recipient. During the holiday shopping season, however, merchants are likely to see up to four times as many orders each day with a mismatch between billing and shipping addresses.
Now it’s your turn
These are just a few ways that data-driven decisions can aid merchants in the critical work of stopping chargebacks. From maximizing revenue to limiting friction, operational frustration, and damage to brand reputation, knowing more about how your customers shop is an easy investment that’ll pay off over and over again.